
Data thatfinally speaks up
Scattered spreadsheets, late reports and numbers that never match become a single source of truth: an enterprise data warehouse, automated ETL and dashboards managers trust every morning.
0+
Executive dashboards
0%
Less time on reporting
0+
Data sources unified
0
Specialist roles
Capabilities
What this department builds
Data warehouses, ETL processes and management dashboards that put the organization’s KPIs in front of managers — live, accurate and reliable.
Enterprise data warehouse
One source of truth across every operational system.
ETL & integration
Automated, scheduled data movement with SSIS and Power Query.
Interactive dashboards
Power BI dashboards with filters, drill-down and role-based access.
Analytical modelling
SSAS cubes and semantic models for fast multi-dimensional analysis.
KPI design
Defining metrics that genuinely connect to business goals.
Data-driven culture
Training managers and teams to decide with data.
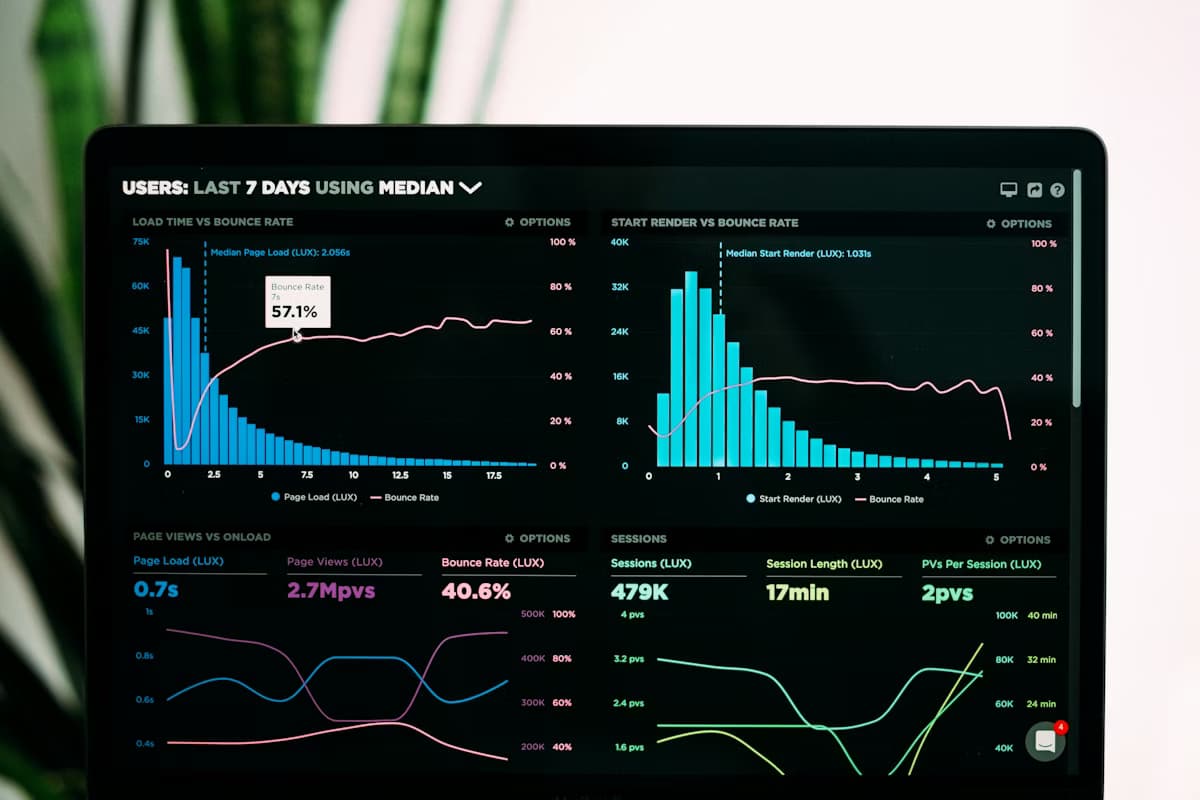
Live dashboard
A look inside the data control room
Our dashboards are more than charts. Switch the period and watch every KPI recalculate on the spot.
Good decisions start with the right number.
Revenue (bn)
4.8
▲Orders
1,240
▲Margin
18.2%
▲OEE
84%
▲Sales trend
Product mix
- Fabric48%
- Yarn32%
- Apparel20%
How we work
From idea to impact, step by step
Step 1
Find the KPIs
We sit with managers to learn which numbers actually drive decisions.
Step 2
Unify sources
Connecting ERP, accounting, sales and production to the warehouse.
Step 3
Model & visualise
A semantic model and clear, interactive dashboards.
Step 4
Train & grow
Handover to your team with training and ongoing support.
The team
The specialists behind the work
BI analyst
KPI design and business analysis
ETL & data warehouse engineer
SSIS and source integration
Power BI developer
Dashboards and interactive reports
Data modeling specialist
SSAS and analytical cubes
Database administrator
SQL Server and performance
Data transformation consultant
Data culture and executive training
Toolbox
Technologies we work with every day
Key outputs
Live management dashboards
Enterprise data warehouse
Automated reporting
Client team training
Real scenarios
Problems we solve
Problem
Factory departments weren’t integrated and there was no online reporting.
Result
A live production, sales and finance dashboard at a glance.
Problem
The monthly board report took two weeks.
Result
Automated reports, ready on the morning of day one.
Problem
Branch and agent performance couldn’t be compared.
Result
Live ranking and comparison of every branch.
Work
Projects this team contributed to
Bring your challenge to this team
A short, free session with this department's specialists — no commitment, and a clear roadmap at the end.